How to monitor Sidra's Integration Hub (IH)
Within Azure Service Bus monitoring, key metrics are available to assess and track the health, resource utilization, and performance of Azure Service Bus. Continue reading to discover more about these metrics.
Overview
In the DSU resources group(s) where your Azure Service Bus has been automatically deployed by Sidra, select the resource Service Bus Namespace. As a first view of metrics, you can click on Overview where several default graphs are displayed regarding some metrics as incoming requests, successful requests, server errors, user errors and throttled requests along with the total incoming and outgoing messages.
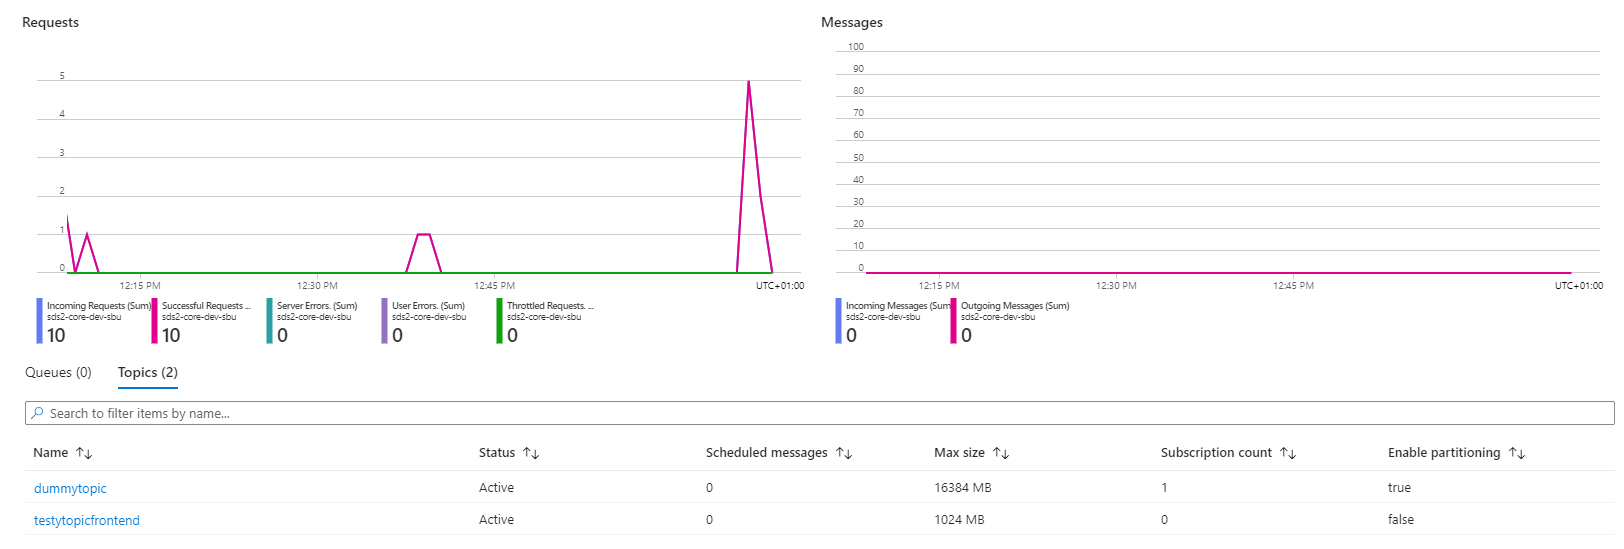
Entities section
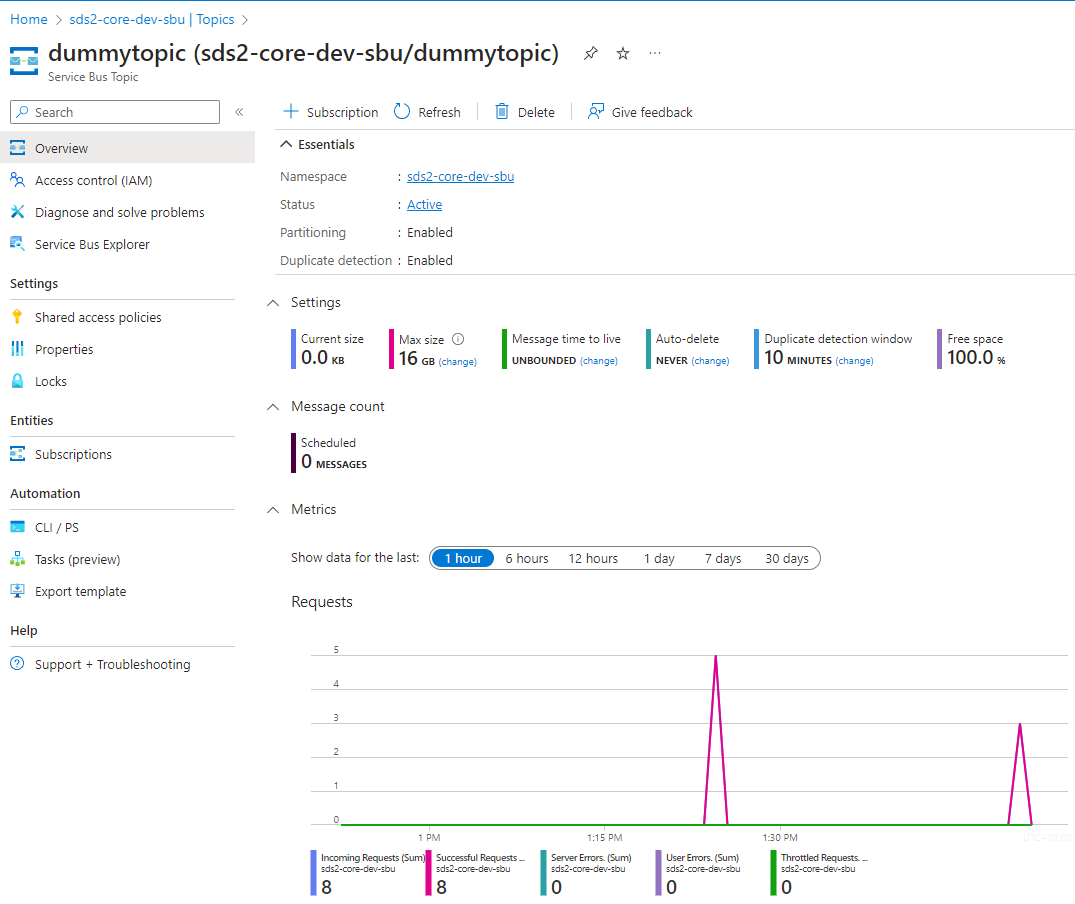
In terms of Azure Service Bus, Entities refers to the fundamental components used for communication and message handling, these are Queues and Topics. In this section, by clicking on the registered Queues or Topics, details about the configuration are displayed along with default metrics.
Monitoring
Insights
In the Insights section, within the Monitoring panel, there is a breakdown by topic of the default metrics regarding Requests previously discussed in the overview section along with graphs displaying the time series. Here, you can select as well the Messages option to display the same graphs about count of incoming and outgoing messages per topic among others.
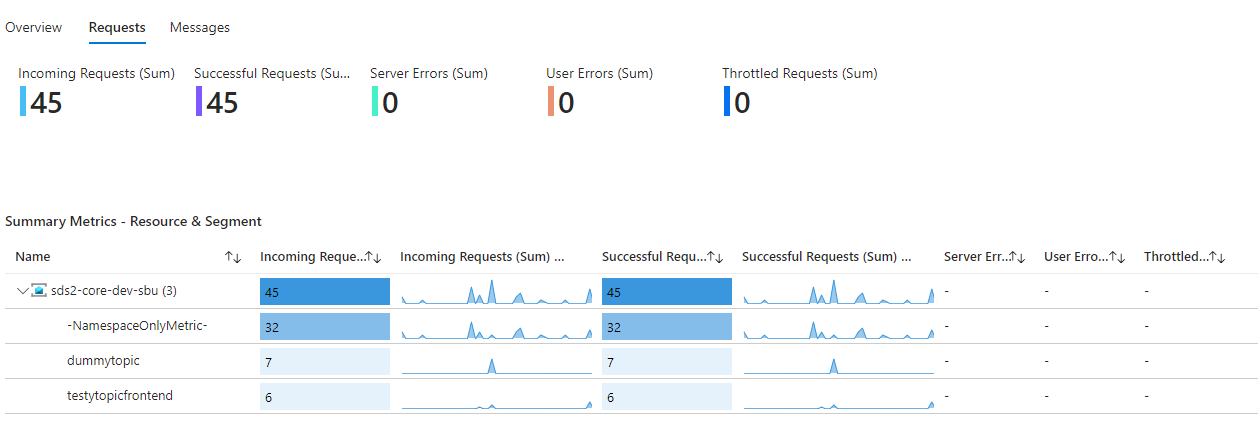
The view of configured messages is not available from Azure Portal. For additional monitoring and messages content view, check out on tools like Serverless360.
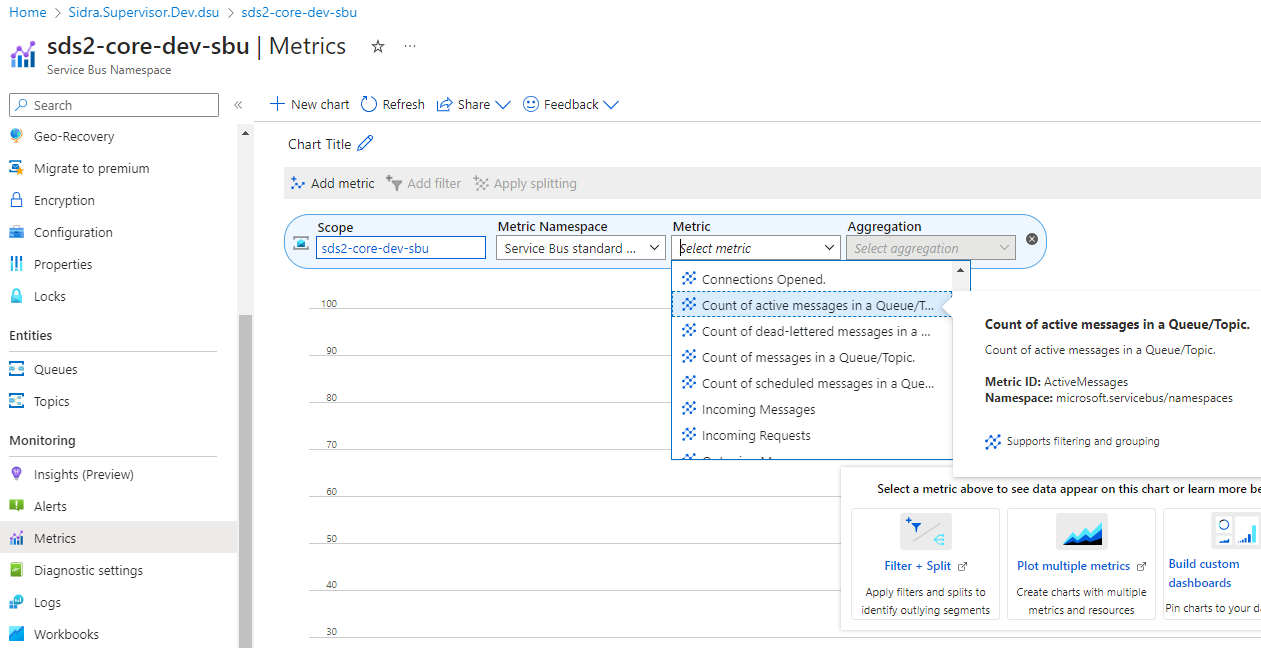
Metrics
The most important metrics for Azure Service Bus monitoring include the following:
- DeadLetter Message Count: Number of dead-lettered messages in a Queue/Topic, monitored to avoid exceeding the maximum capacity of the dead-letter Queue/Topic.
- Message Count: Count of messages in a Queue/Topic. This metric includes messages in all the different states like active, dead-lettered, scheduled, etc.
- Active Connections: The number of active connections on a namespace and on an entity in the namespace. Value for this metric is a point-in-time value. Connections that were active immediately after that point-in-time may not be reflected in the metric.
- Size: Capacity of the Queue/Topic (Entity) to store incoming messages (Bytes).
- Throttled Requests: The number of requests that were throttled because the usage was exceeded in the Azure Service Bus.
For more information about metrics, check the official Microsoft documentation.