Sidra Web sections
Below a little description of the different sections of Sidra Web is displayed.
Keep in mind that this is a general section displaying the primary services on Sidra Web. Please check the services sections itself to obtain documentation for each of the services screens and versions.
Data Catalog
From the data catalog view, users can navigate or search through all the Providers and Entities which are visible given the permissions in place. Sidra Data Catalog provides data management capabilities from a user-friendly interface.
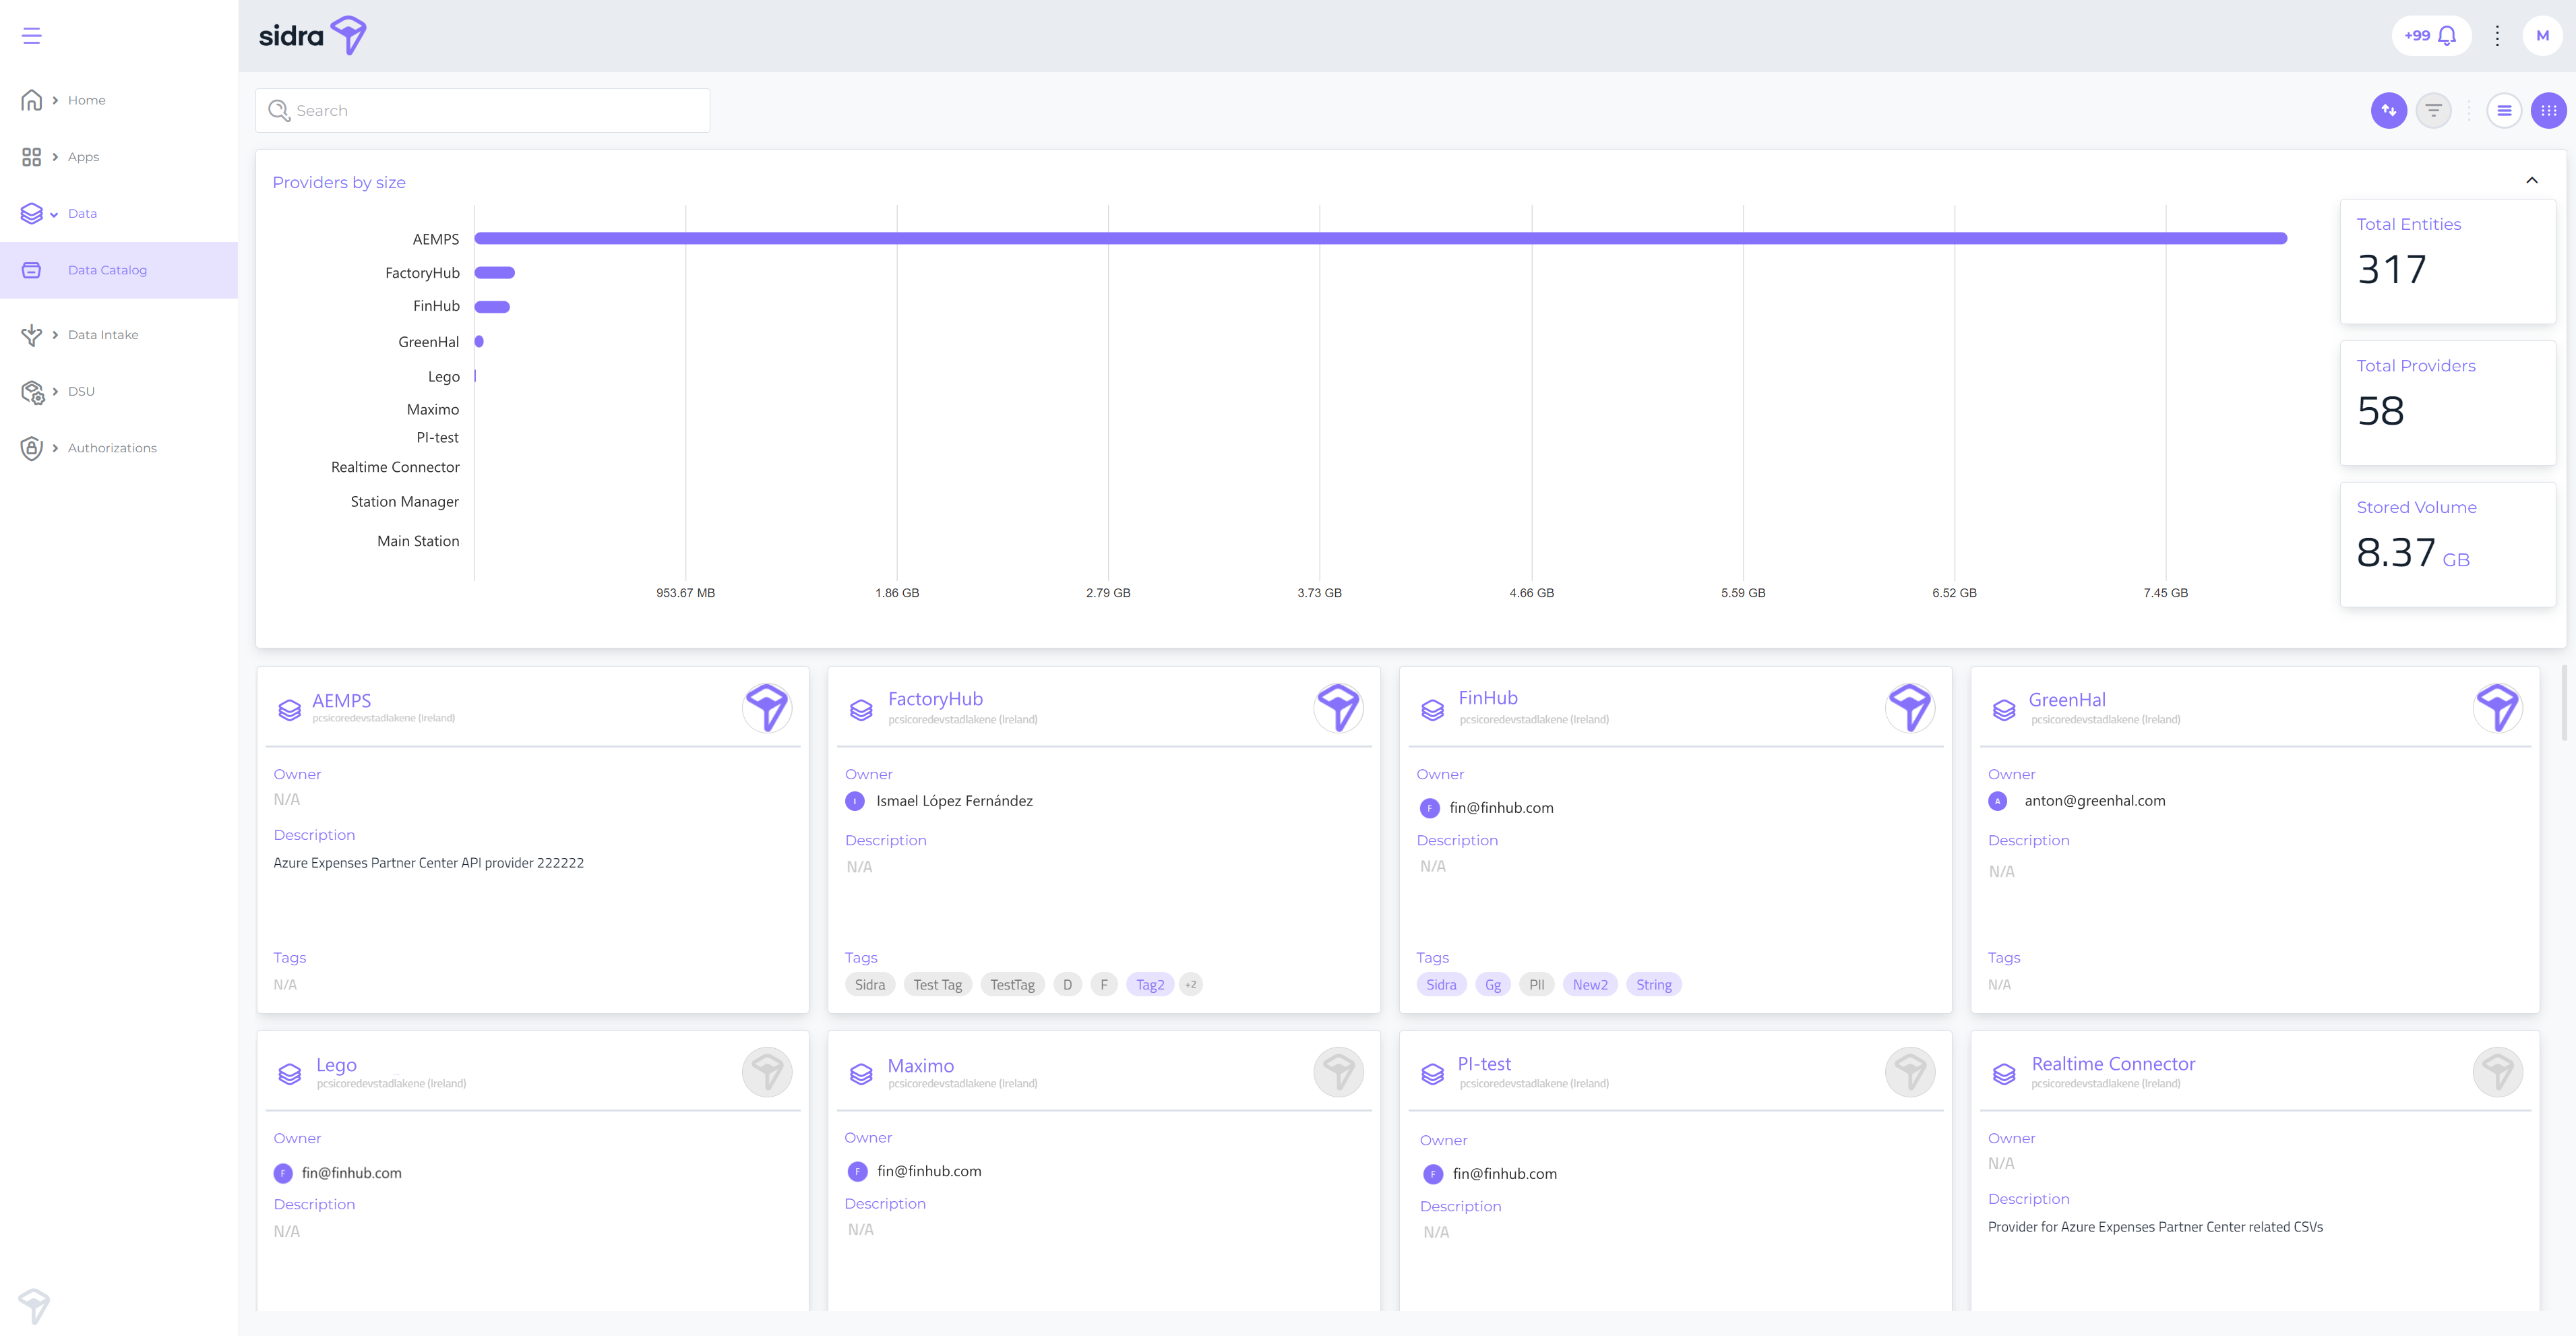
A detailed documentation about the Sidra Data Catalog is found in the Data Catalog page.
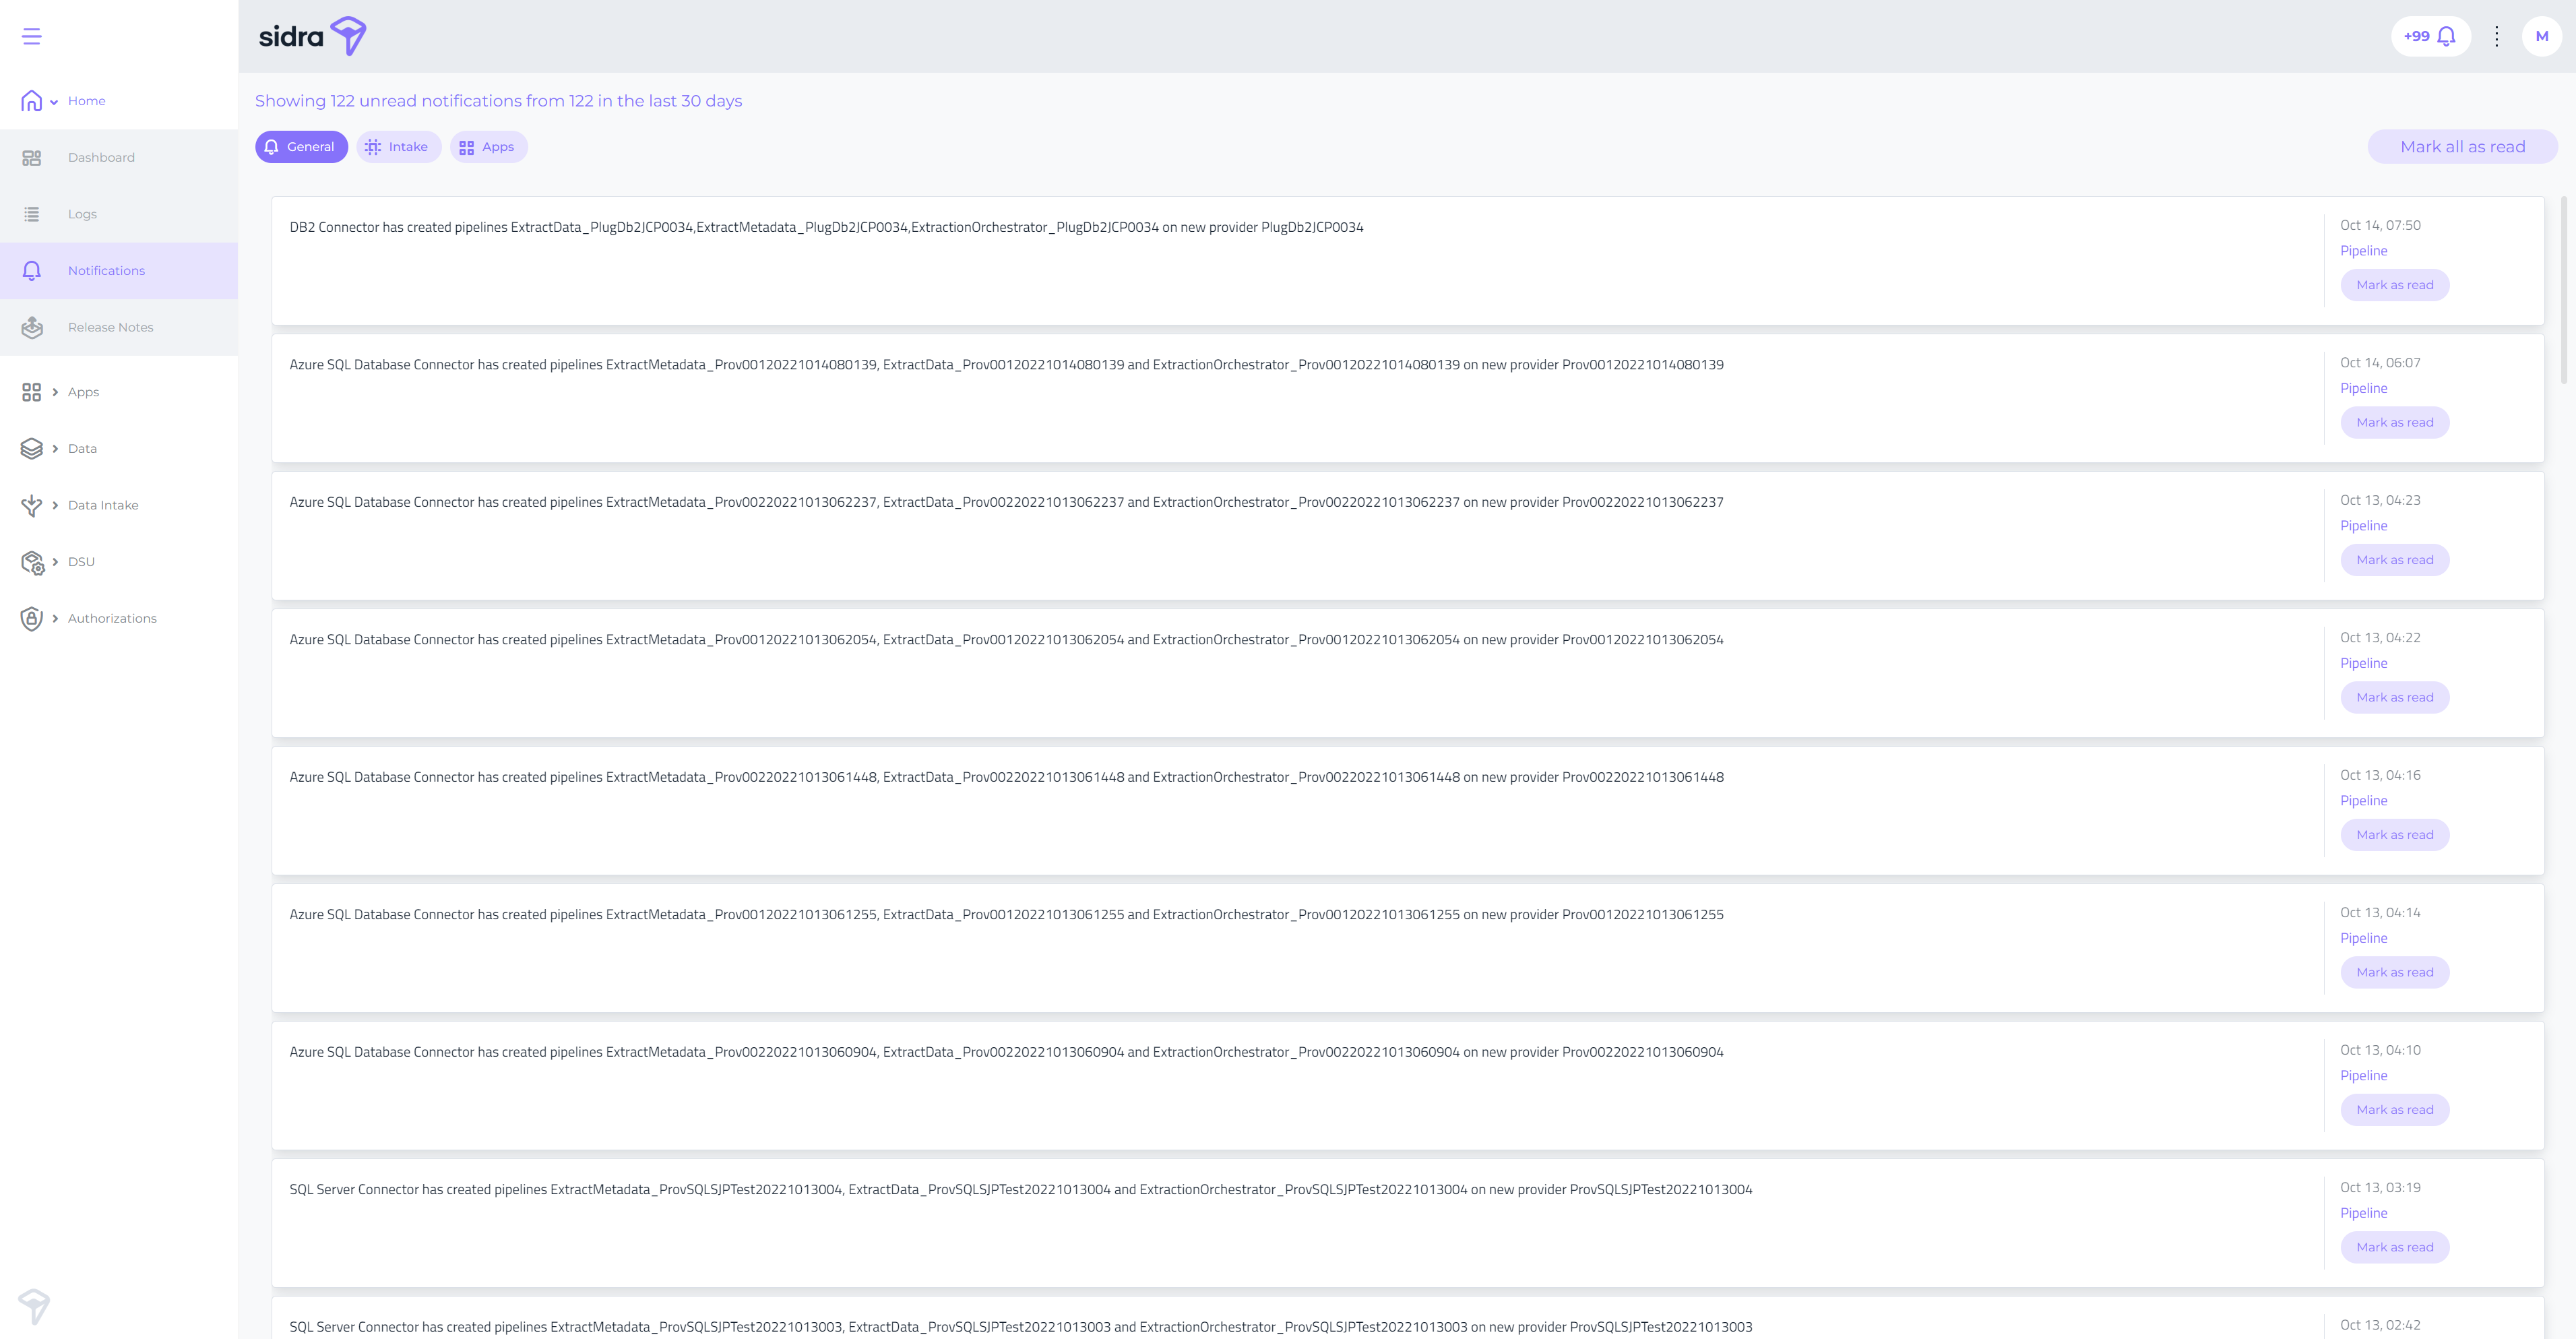
Notifications
Besides the notifications widget, a full-size section has been created to review these notifications with a larger area for the text descriptions.
This detailed notification list can be accessed either by the widget, or via the new Notifications menu option, under the Home main menu option.
The Notifications page displays a full list of unread notifications in the Sidra installation that the Web is associated to.
From this page, notifications can be marked as read, which means that they will no longer appear in the UI for that user, however, they will still be available in the Core.Notifications table.
Log Search
The Logs page in Sidra Web displays the latest logs as they are retrieved from the Util.Log table. This page includes several filters to refine searches.
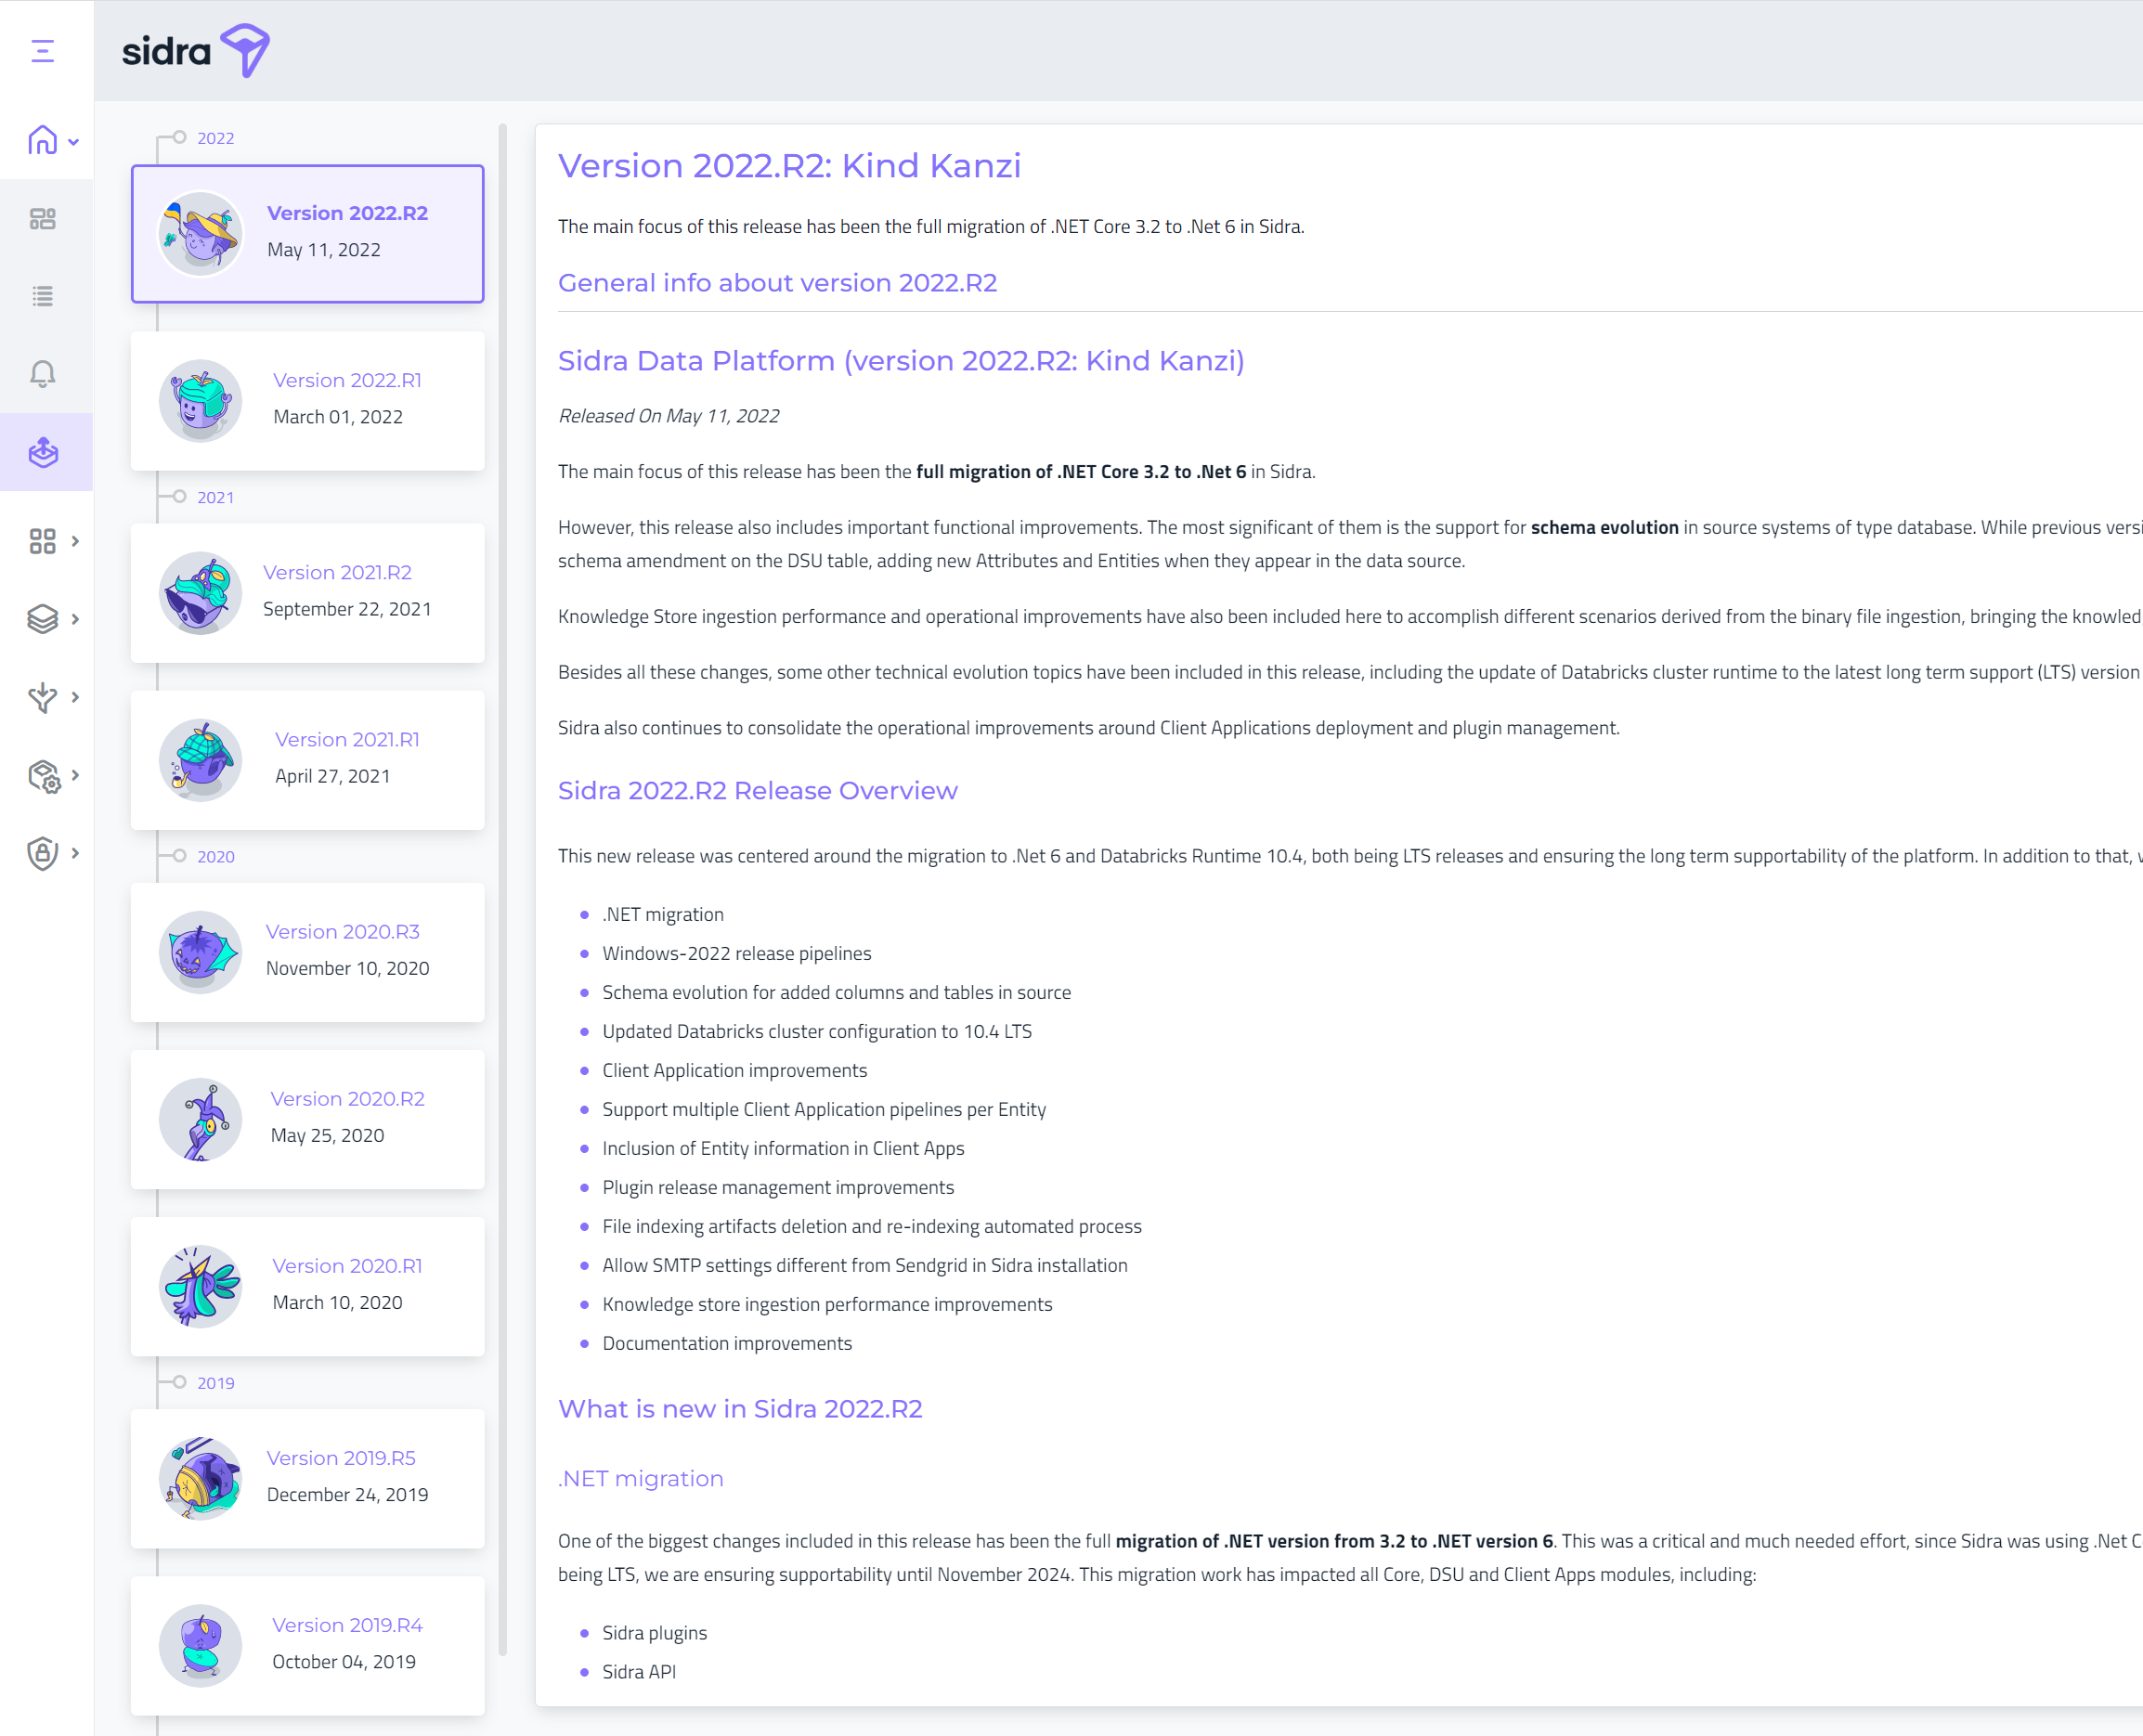
Release Notes
The Release Notes page includes a list of all past releases of Sidra. Clicking on each item, it is possible to see the full details of each release as also included in the Release Notes of Sidra Documentation.
Data Products Catalog
The Data Products catalog allows the user to explore the different Data Products registered on the system.
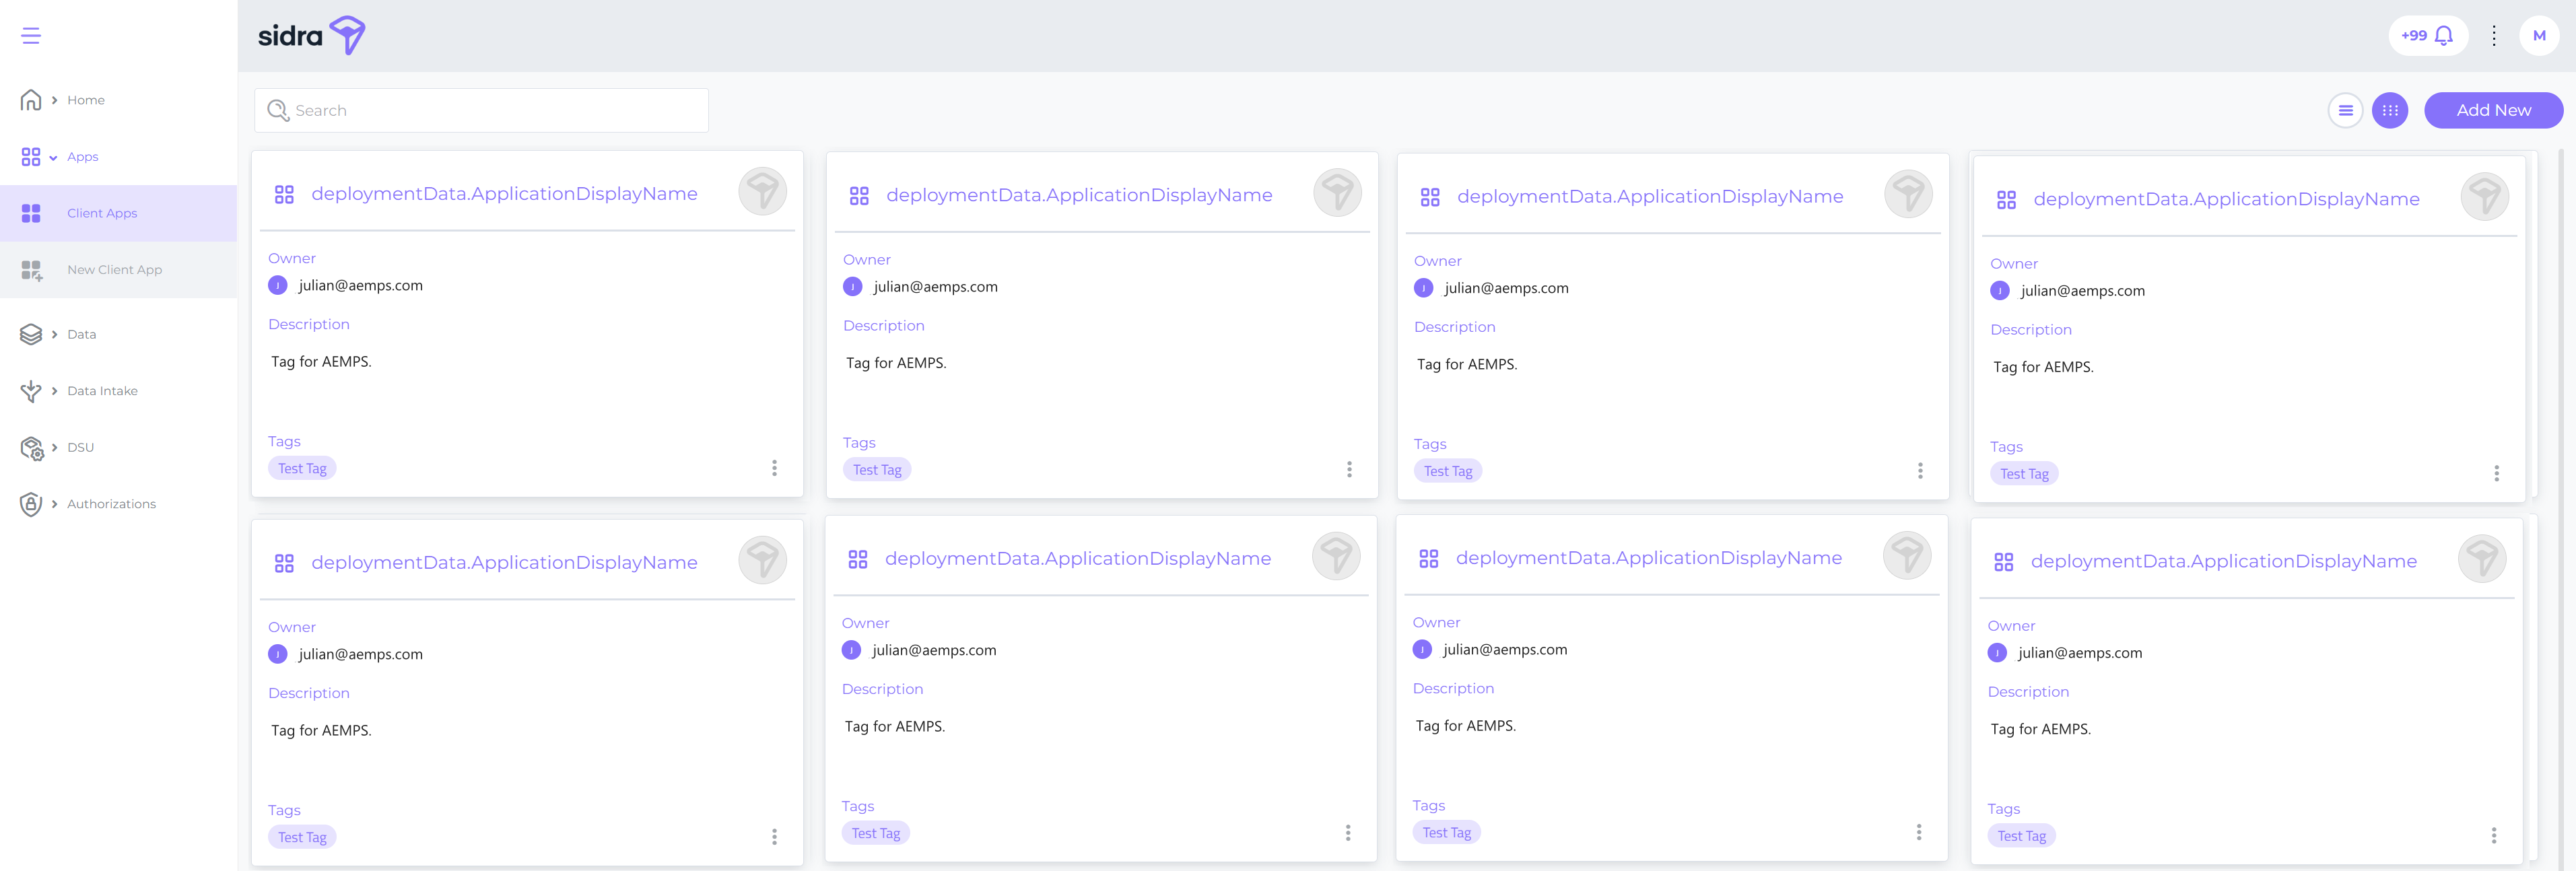
In the 2023.11 release, configuration of Data Products can be performed through the Sidra Web interface, as shown below.
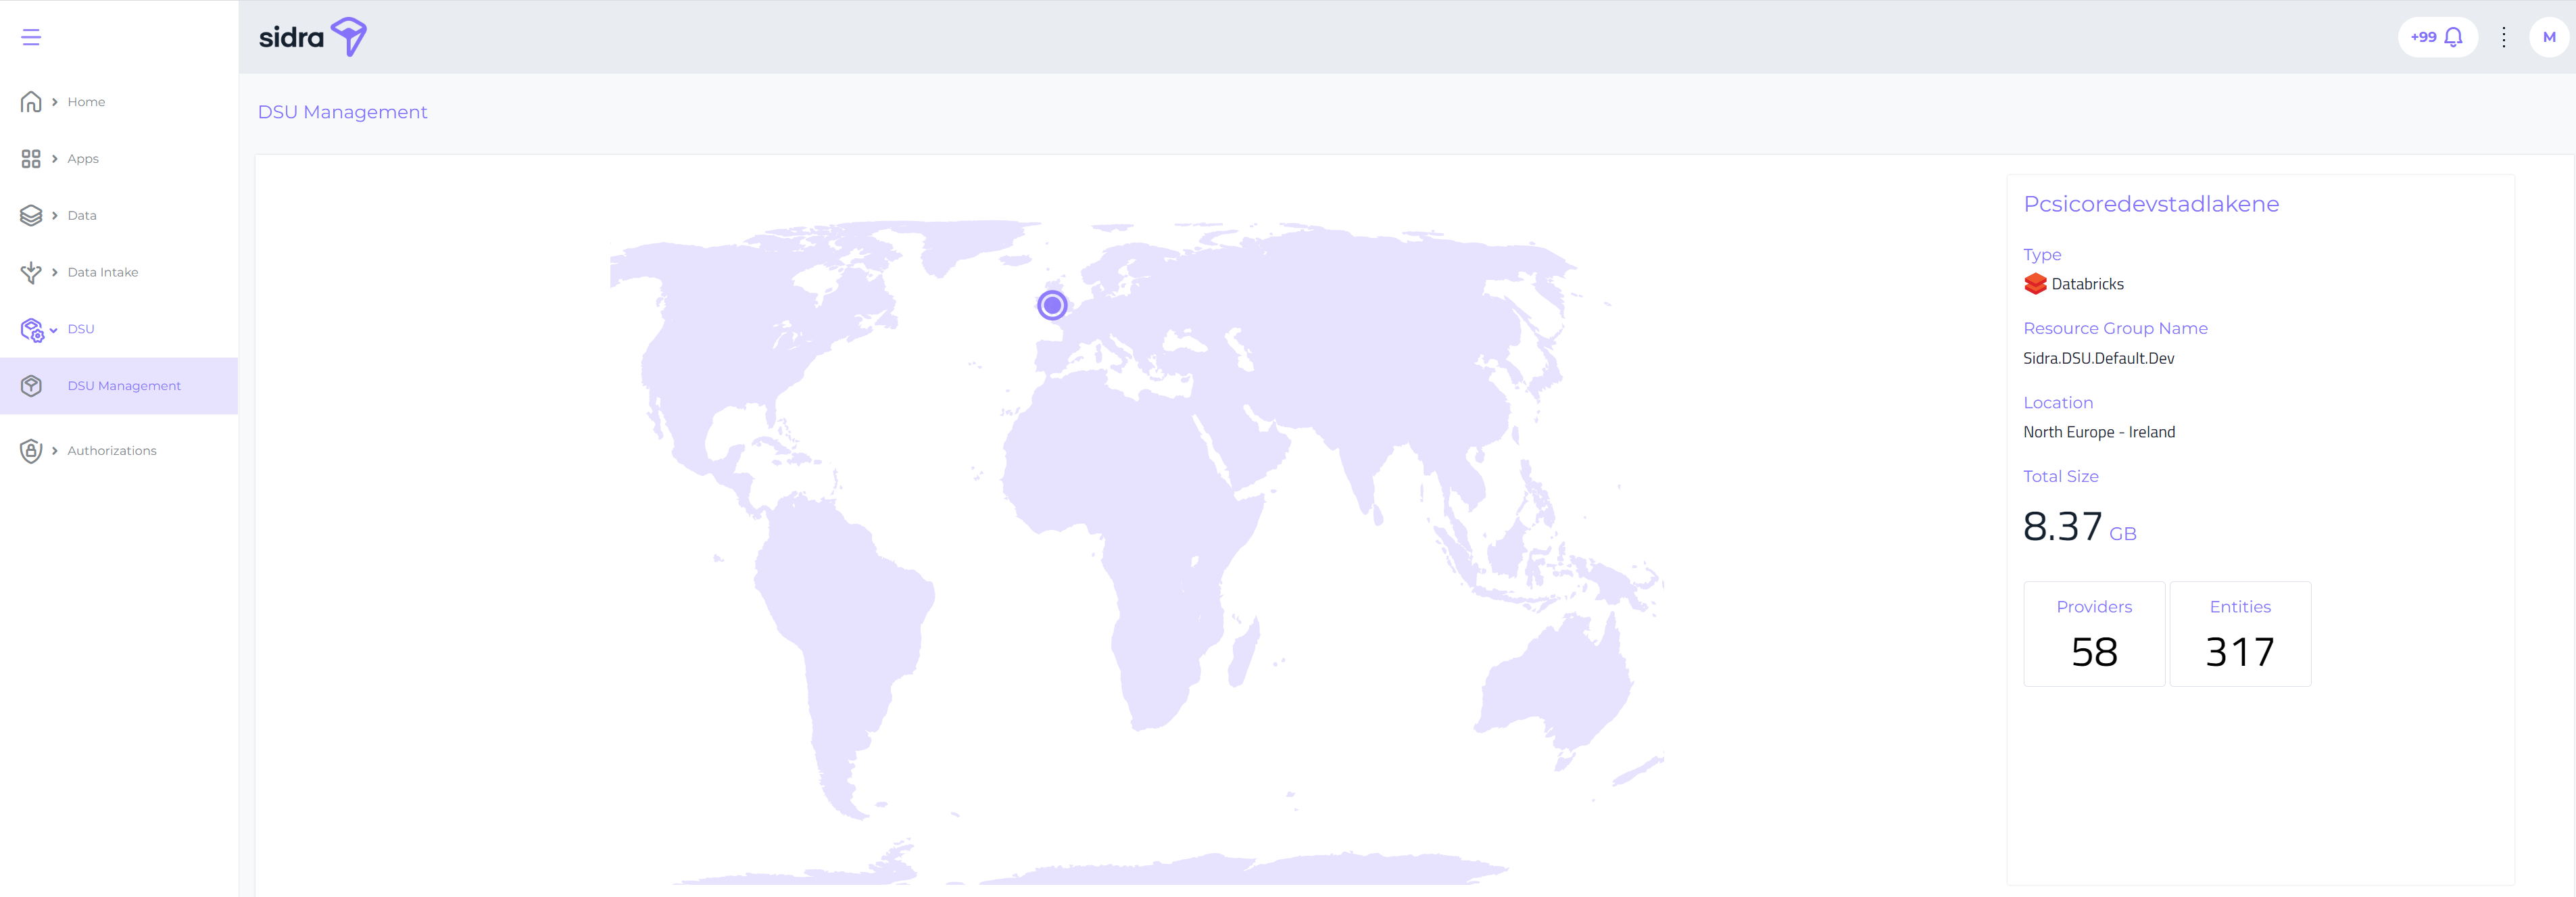
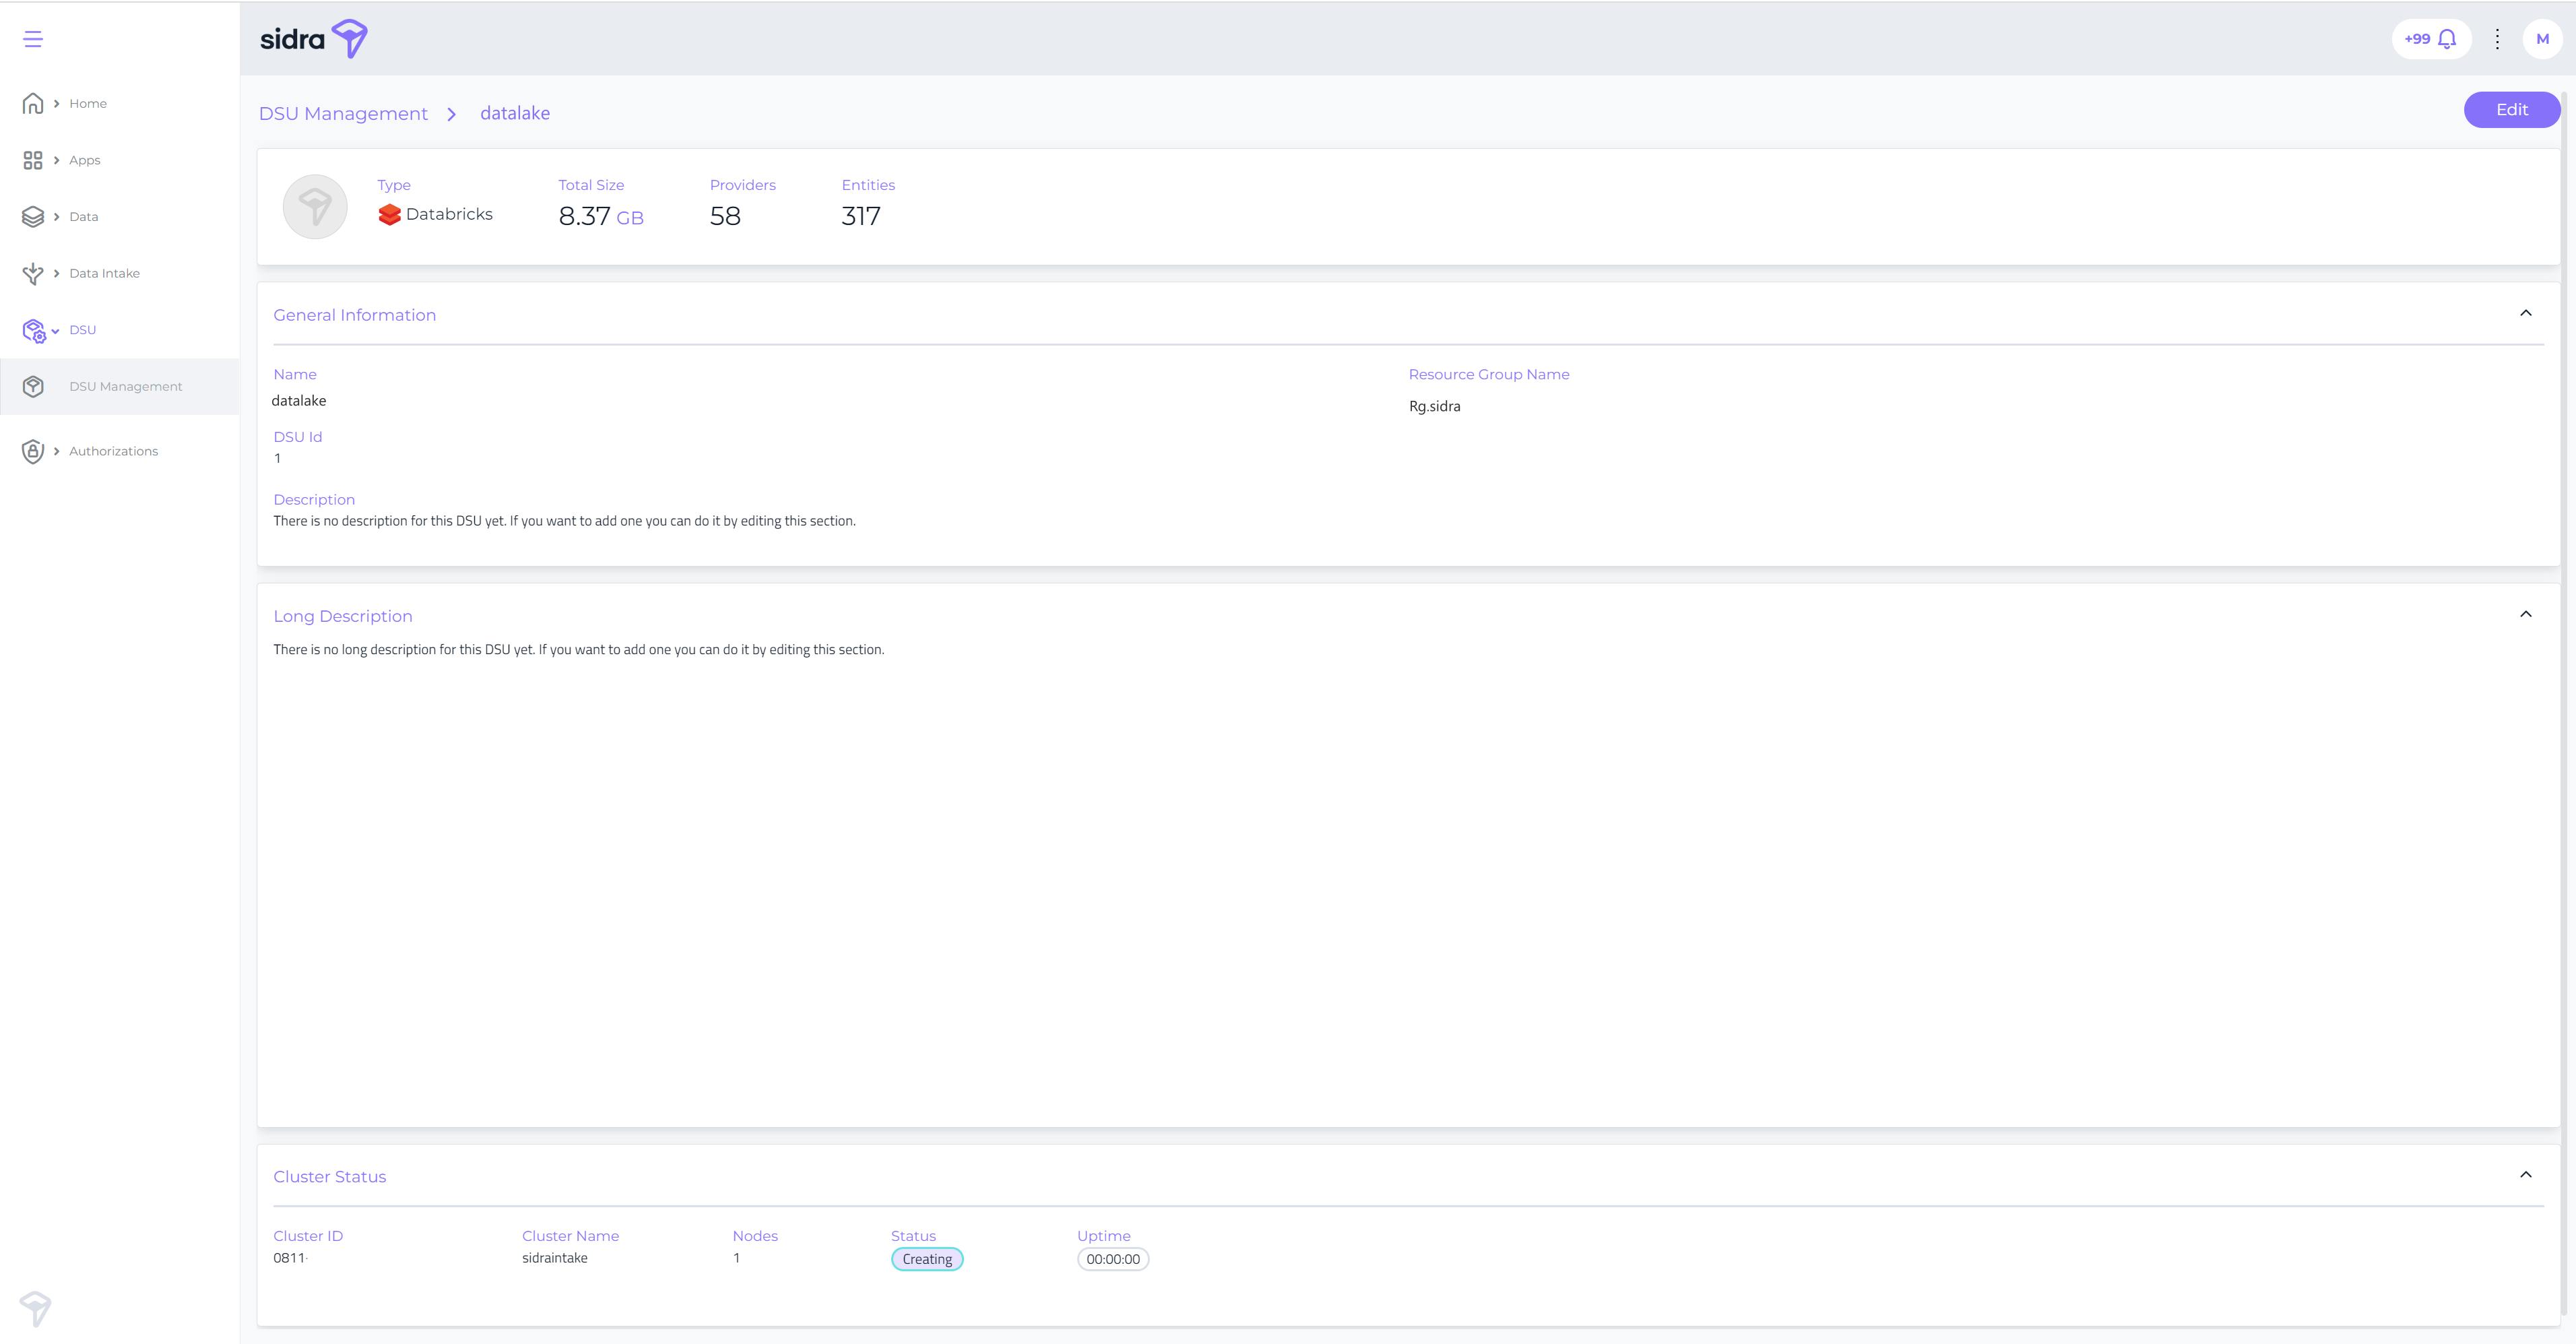
DSU Management
In this section, the main information about each of the DSUs configured and deployed in the Sidra installation can be checked.
These pages show configuration and metadata-related information for the DSU, such as details for the Databricks cluster, resource groups, and number of Providers and Entities.